Make your GLB files load fast everywhere
Upload a GLB or GLTF to see how heavy it feels on phones, headsets, and storefronts. Get plain-language tips to trim textures, draw calls, and animation weight before launch.
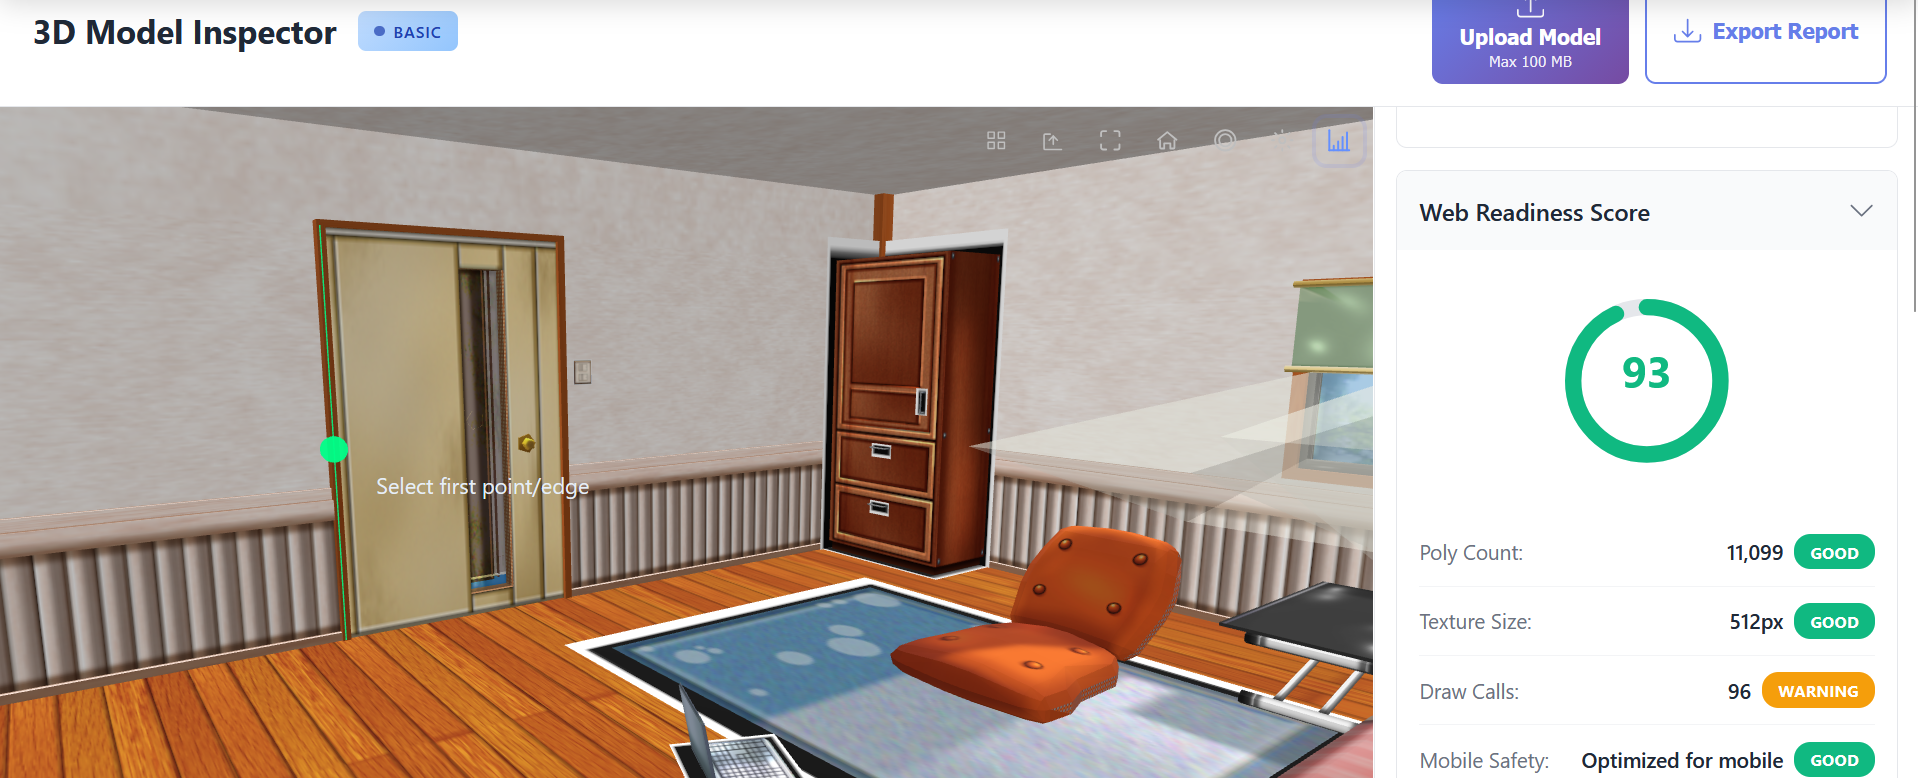
- ⚡ See a WebGL readiness score at a glance
- 📱 Check mobile and headset performance risks
- 📊 Compare poly counts against sane budgets
- 🎨 Audit texture sizes before they choke bandwidth
Why GLB Optimization Matters
Faster page loads convert more shoppers and reduce bounce rates.
Mobile-first optimization keeps WebGL scenes smooth on mid-range devices.
Consistent 60fps experiences drive engagement in configurators and virtual try-ons.
Slimmer GLB payloads cut CDN bandwidth and improve Core Web Vitals.
Powerful Features
Web Readiness Score
Our scoring engine evaluates triangle counts, textures, shader complexity, lights, and animation clips to deliver a 0-100 readiness score that mirrors real-world storefront and configurator performance.
Device-Tuned Poly Budgets
Compare your asset against recommended triangle budgets for desktop, flagship mobile, and legacy hardware. Identify meshes that should be decimated or swapped for imposters.
Texture Payload Inspector
Audit basecolor, normal, ORM, emissive, and HDR environment maps. Spot oversized or duplicate textures and get compression targets for KTX2/Basis workflows.
Draw Call & Material Merge Advisor
Quantify unique material and mesh combinations to reveal draw call bottlenecks. Receive actionable tips for batching, instancing, and material atlasing.
Mobile & XR Compatibility Audit
Check WebGL feature usage, GPU memory footprint, and shader precision demands to ensure compatibility with Safari iOS, Android Chrome, Meta Quest, and VisionOS.
Animation & Interaction Diagnostics
Evaluate animation clip durations, skin weights, morph targets, and interactive hotspots to anticipate runtime cost in three.js, Babylon.js, and WebXR engines.
Shareable Optimization Reports
Export PDF and JSON reports detailing bottlenecks, recommended budgets, and prioritized fixes so engineers, artists, and marketers stay aligned.
How It Works
Upload GLB/GLTF
Drop in any GLB, GLTF, or USDZ export. Assets process locally in your browser — no uploads to external servers.
Review Performance Dashboard
Inspect readiness scoring, poly budgets, texture payloads, animation weight, and draw call breakdowns with interactive charts.
Optimize & Share Reports
Apply suggested decimation, texture compression, and material merges. Export reports to share with stakeholders and re-run checks until target scores are met.
Perfect For
Optimize GLB/GLTF Assets for Lightning-Fast Web Experiences
Before you deploy a 3D configurator, digital twin, or AR preview, run your GLB through the optimization checker. The analyzer executes locally in the browser using WebGL and WebAssembly, delivering immediate insight into triangle counts, material complexity, animation weight, and compressed payload size. No files leave your environment, making it safe for unreleased product models and NDA-bound campaigns.
Hit Poly Budgets Without Guesswork
The checker benchmarks your meshes against proven budgets for desktop, tablet, and mobile hardware. Visual density maps reveal where geometry can be decimated, while per-mesh stats show exactly which subcomponents need retopology. Export the findings to direct artists toward the highest-impact optimizations.
Dial In Texture Payloads
Texture payload usually consumes more bandwidth than geometry. Audit every map in your GLB — basecolor, normal, ORM, emissive, and reflection probes — to identify oversized files or duplicate atlases. Receive precise instructions for converting to KTX2, adjusting mip levels, or consolidating texture sets to keep GPU memory under control.
Stay Within Draw Call Limits
High draw call counts crush frame rates. The analyzer calculates material and mesh combinations, then recommends batching, instancing, and atlas strategies. With the guidance, you can merge materials or split models intelligently to maintain high fidelity while hitting 60fps targets.
Plan for Mobile, XR, and VisionOS
WebGL capabilities differ widely between browsers, GPUs, and headsets. The checker evaluates shader precision usage, texture format compatibility, and GPU memory footprint to warn you about potential issues on iOS Safari, Android Chrome, Meta Quest, and Apple Vision Pro. Build one asset pipeline that works everywhere.
Keep Stakeholders Aligned
Attach PDF or JSON reports to Jira tickets, share them with agencies, or send them to brand partners. The documentation spells out current performance metrics, target budgets, and recommended next steps so every team knows what “optimized” means for your business case.
Frequently Asked Questions
What is a good polygon count for web?
For hero ecommerce assets we recommend 35k-60k triangles on desktop and 20k-40k on mobile. Background props should target <20k. The checker benchmarks your models against these ranges.
How do texture sizes affect performance?
Textures dominate download size and GPU memory. The analyzer flags maps over 2048px, identifies duplicate atlases, and proposes Basis/KTX2 compression targets to shrink payloads.
What are draw calls and why do they matter?
Each unique mesh-material pair triggers a draw call. Surpassing ~120 draw calls can tank mobile frame rates. The report highlights consolidation opportunities via material atlasing or instancing.
Does the checker evaluate animations?
Yes. It surfaces total animation length, morph target counts, and skin weight limits so you can trim idle loops and compress skeletal rigs before export.
Can I share the analysis with clients?
Export branded PDF or JSON summaries to share performance targets with agencies, brands, or platform partners. Reports capture before/after metrics for easy approval.
Ready to Inspect Your 3D Model?
Start analyzing your models for free. No sign-up required.